



Am satisfied with what i learned in visual elements and charts and through more practice i wil become better and better thanks totmind🤝🤝

Everything has been good and so clear. Thank you

This has been a very interesting module to work on every time i came across a lesson. This was due to the fact that every lesson was an additional to the knowledge i had gathered before. This module was quite more interesting and very okay compared to the excel formulars & functions with this all is within the excel tables one has to know what, when & what's required, therefore qtn interpretation is key, how to use different excel tabs on the ribbon menu is key and how to insert, visualize, create shapes and some few different formulars that may be needed to produce the best Data Analysis.

I have had a chance to learn new time saving methods that i didn't know before

The best part was creating charts.

The best part was creating charts so easily. I used to think it was so complicated to come up with a chart that is meaningful. The rating is 4 because I need to practice to make sure I have mastered what I have learnt. Getting help when I am stuck is not so easy because the partner I was assigned does not even respond. So, sometimes I spend some good time trying to figure out the challenges I meet when doing the assignments.

I find this module very informative. I have learned a lot, and I wish to learn more.
A big thanks to Totmind School for the wonderful job🙏

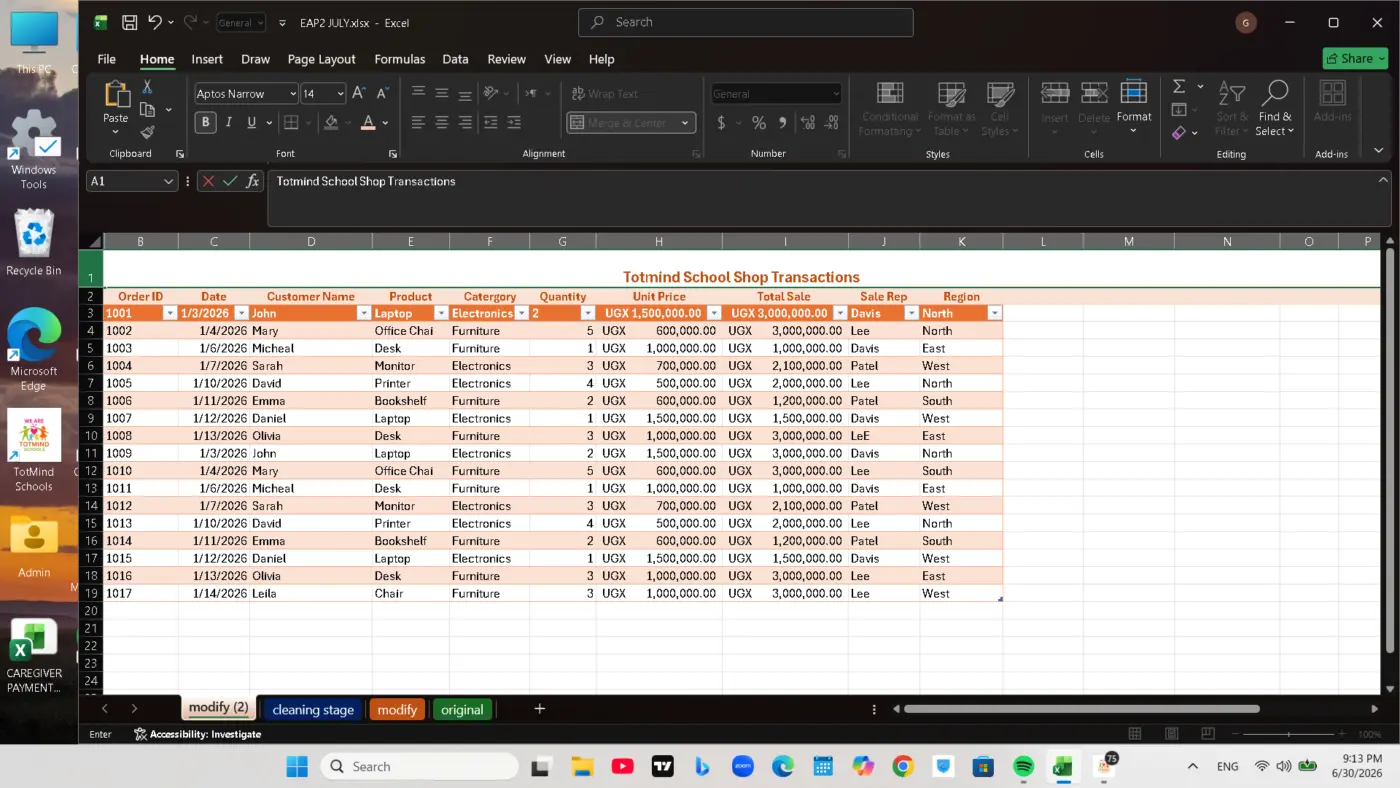

What has been disturbing alot was switching between programmes on the laptop. But now i have fully understood it both ways using the task bar or by using Alt + Tab

My best topic was data validation as this helps you to automatically control the data in the cell and make work look organised and systematic.
i suggest regular Assessments to be provided to us so as to always refresh our minds.